SCHEME OF WORK
WEEK TOPIC
1. Measures of Central Tendency: Revision of previous work on mean, median and mode. Calculating the Median of a given data. Finding the Mode of given data. Calculate the Mean of any given data.
2. Data Presentation: Pie chart, Bar chart, Histogram - Representation of information on pie charts, Bar chart, etc.
3. Use of measures of Central Tendency to analyze information on drug abuse. Meaning and importance of voting. Counting of votes. Analysis of voting using measures of central tendency.
4-6. General Revision of Basic 7 – 9 works.
7. Mock BECE/JSCE.
8-12. Basic Education Certificate Examination (JSCE).
BASIC TEXT BOOKS:
1. New General Mathematics for Junior Secondary Schools Book 3. By M.F. Macrae et al.
2. Exam Focus: Mathematics for JSCE – By Donatus Igbokwe et al
3. Funtional Mathematics for JSS Book 3. By T.M Asiru et al
3RD TERM
WEEK 1
TOPIC: MEASURES OF CENTRAL TENDENCY (REVISION)
CONTENT:
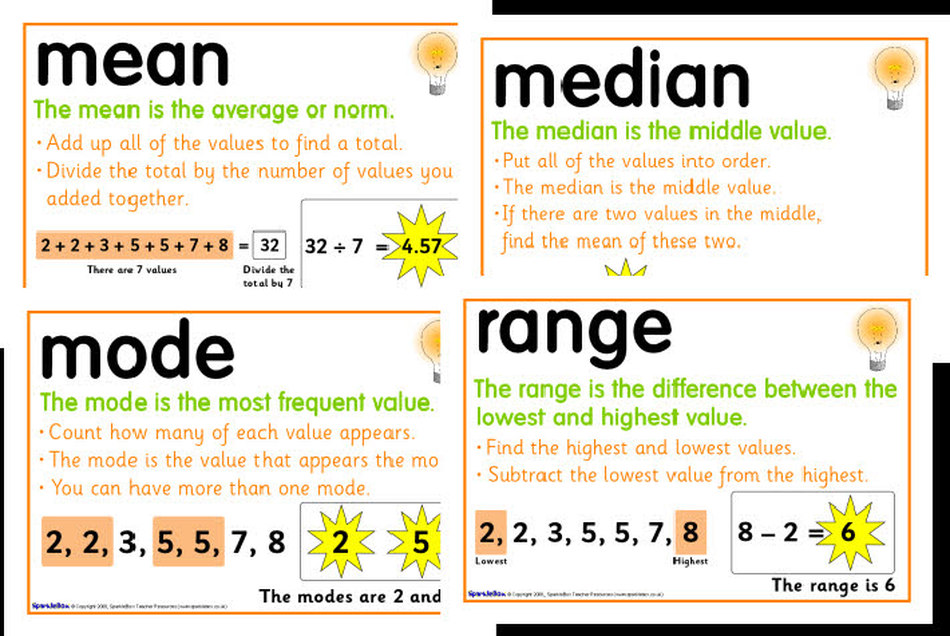
Mean: The average score of a given data.
Median: The score at the middle after rearranging either ascending or
descending order.
Mode: The score with the highest frequency.
Examples:
Find the measures of central tendency of the data below.
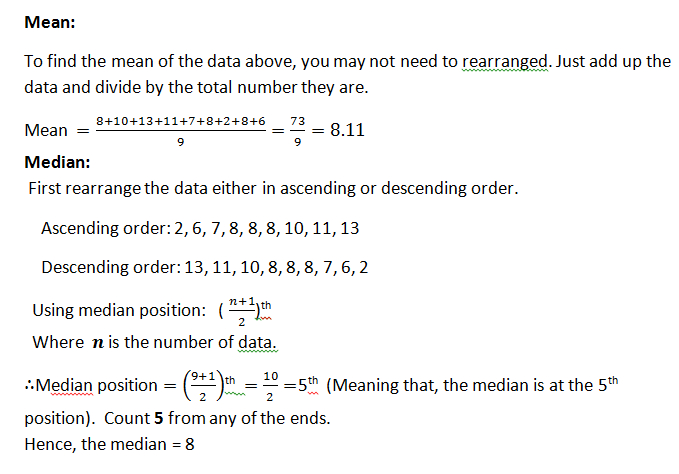
8, 10, 13, 11, 7, 8, 2, 8, 6
MODE:
Mode is the number or score that appears most, i.e, number or score with the highest frequency.
Since ‘8’ appears most, hence, the mode is 8.
FURTHER EXAMPLES
Example 2:
The below table shows the age of under 18 youths caught taking Indian hemp by the police at a T-junction near Olobeja with the following frequency of wrapped Indian hemp found in their possession.
Age(yrs) 13 14 15 16 17
Frequency of wrapped Indian hemp 1 2 5 7 15
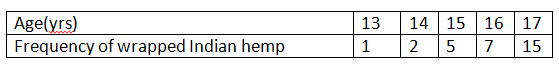
Find the: (i). mean (ii). median (iii). mode of the frequency of the wrapped Indian hemp.
Solution:
Since the data are many, adding up the numbers and then divide by the total number would take a lot of time. So, we need a frequency table.
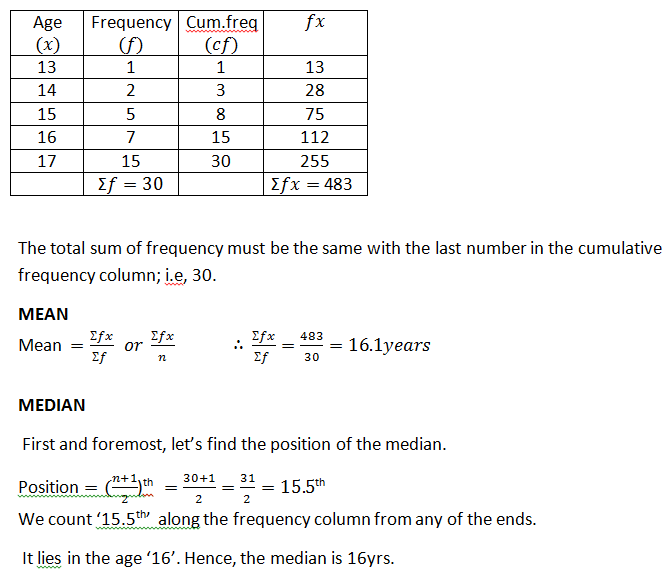
Age
(x) Frequency
(f) Cum.freq
(cf) fx
13 1 1 13
14 2 3 28
15 5 8 75
16 7 15 112
17 15 30 255
Ʃf=30 Ʃfx= 483
The total sum of frequency must be the same with the last number in the cumulative frequency column; i.e, 30.
MEAN
Mean =Ʃfx/(Ʃf ) or Ʃfx/n ∴ Ʃfx/(Ʃf )=483/30=16.1years
MEDIAN
First and foremost, let’s find the position of the median.
Position =((n+1)/2)th =(30+1)/2=31/2=15.5th
We count ‘15.5th’ along the frequency column from any of the ends.
It lies in the age ‘16’. Hence, the median is 16yrs.
MODE
Check for the highest frequency along the frequency column.
It is ‘15’. Right?
What age has 15?
Hence, the mode is 17yrs
Example 3:
The marks of 20 students in a mathematics test score out of 10 are as follows:
5, 8, 6, 7, 4, 9, 5, 7, 7, 0, 2, 1, 3, 9, 8, 4, 6, 7, 8, 1
Prepare a frequency table for the distribution and find the measure of central tendency.
Solution:
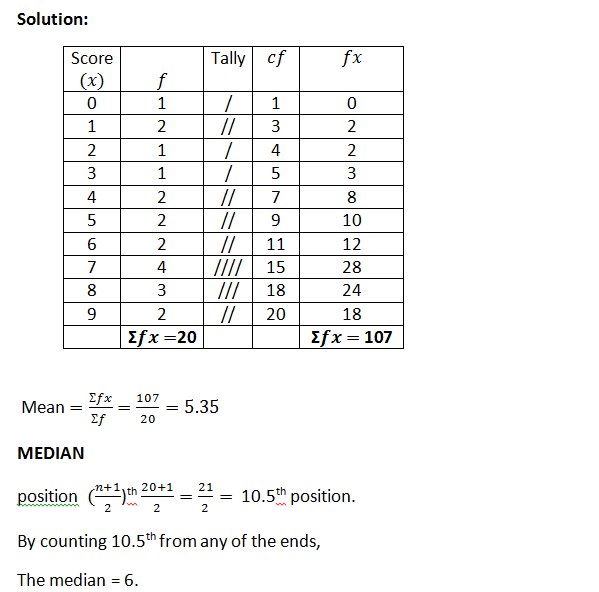
Score
(x)
f Tally cf fx
0 1 / 1 0
1 2 // 3 2
2 1 / 4 2
3 1 / 5 3
4 2 // 7 8
5 2 // 9 10
6 2 // 11 12
7 4 //// 15 28
8 3 /// 18 24
9 2 // 20 18
Ʃfx=20 Ʃfx= 107
Mean =Ʃfx/(Ʃf )=107/20=5.35
MEDIAN
position ((n+1)/2)th (20+1)/2=21/2= 10.5th position.
By counting 10.5th from any of the ends,
The median = 6.
MODE
The mode = 7.
ASSIGNMENT:
Functional Mathematics for JSS. Book3. Ex.12.1,pg 188 No. 3,6-10; Ex.12.3,pg 192 No. 5&6.
New General Mathematics for JSS Book3. Ex. 16b pg 156 No. 4-6
Further Studies
http://onlinestatbook.com/2/summarizing ... uresM.html
CONTENT:
Mean: The average score of a given data.
Median: The score at the middle after rearranging either ascending or
descending order.
Mode: The score with the highest frequency.
Examples:
Find the measures of central tendency of the data below.
8, 10, 13, 11, 7, 8, 2, 8, 6
MODE:
Mode is the number or score that appears most, i.e, number or score with the highest frequency.
Since ‘8’ appears most, hence, the mode is 8.
FURTHER EXAMPLES
Example 2:
The below table shows the age of under 18 youths caught taking Indian hemp by the police at a T-junction near Olobeja with the following frequency of wrapped Indian hemp found in their possession.
Age(yrs) 13 14 15 16 17
Frequency of wrapped Indian hemp 1 2 5 7 15
Find the: (i). mean (ii). median (iii). mode of the frequency of the wrapped Indian hemp.
Solution:
Since the data are many, adding up the numbers and then divide by the total number would take a lot of time. So, we need a frequency table.
Age
(x) Frequency
(f) Cum.freq
(cf) fx
13 1 1 13
14 2 3 28
15 5 8 75
16 7 15 112
17 15 30 255
Ʃf=30 Ʃfx= 483
The total sum of frequency must be the same with the last number in the cumulative frequency column; i.e, 30.
MEAN
Mean =Ʃfx/(Ʃf ) or Ʃfx/n ∴ Ʃfx/(Ʃf )=483/30=16.1years
MEDIAN
First and foremost, let’s find the position of the median.
Position =((n+1)/2)th =(30+1)/2=31/2=15.5th
We count ‘15.5th’ along the frequency column from any of the ends.
It lies in the age ‘16’. Hence, the median is 16yrs.
MODE
Check for the highest frequency along the frequency column.
It is ‘15’. Right?
What age has 15?
Hence, the mode is 17yrs
Example 3:
The marks of 20 students in a mathematics test score out of 10 are as follows:
5, 8, 6, 7, 4, 9, 5, 7, 7, 0, 2, 1, 3, 9, 8, 4, 6, 7, 8, 1
Prepare a frequency table for the distribution and find the measure of central tendency.
Solution:
Score
(x)
f Tally cf fx
0 1 / 1 0
1 2 // 3 2
2 1 / 4 2
3 1 / 5 3
4 2 // 7 8
5 2 // 9 10
6 2 // 11 12
7 4 //// 15 28
8 3 /// 18 24
9 2 // 20 18
Ʃfx=20 Ʃfx= 107
Mean =Ʃfx/(Ʃf )=107/20=5.35
MEDIAN
position ((n+1)/2)th (20+1)/2=21/2= 10.5th position.
By counting 10.5th from any of the ends,
The median = 6.
MODE
The mode = 7.
ASSIGNMENT:
Functional Mathematics for JSS. Book3. Ex.12.1,pg 188 No. 3,6-10; Ex.12.3,pg 192 No. 5&6.
New General Mathematics for JSS Book3. Ex. 16b pg 156 No. 4-6
Further Studies
http://onlinestatbook.com/2/summarizing ... uresM.html
WEEK 2
TOPIC: DATA PRESENTATION
CONTENT:
Pie chart
Bar chart
Histogram
Pictogram
Bar line, etc
SUB TOPIC: REPRESENTATION OF INFORMATION ON PIE CHARTS.
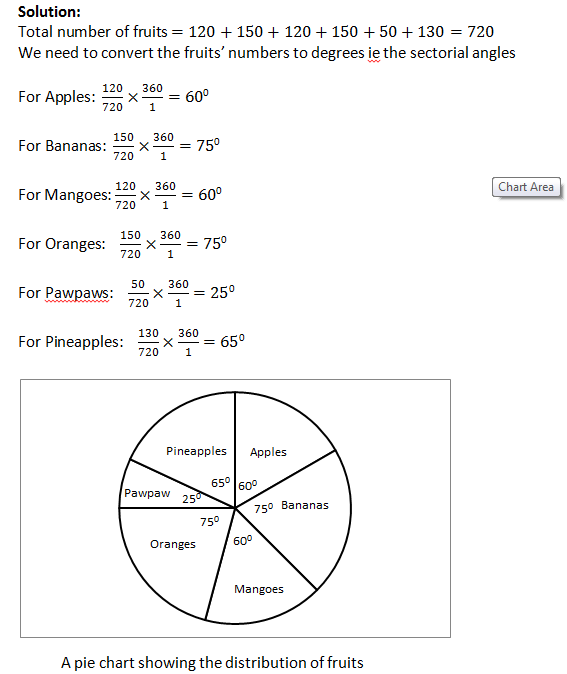
A pie chart is a tool for data representation usually in the form of a circle and divided into sectors such that the angle at the centre is proportional to the frequency representing the item.
Example:
The table below shows the number of fruits sold in a day by a fruit seller.
Types of fruits... Number
Apples ...120
Bananas ...150
Mangoes ...120
Oranges ...150
Pawpaws ...50
Pineapples ...130
Illustrate the information on a pie chart.
Solution:
SUB TOPIC: REPRESENTATION OF INFORMATION ON BAR CHARTS.
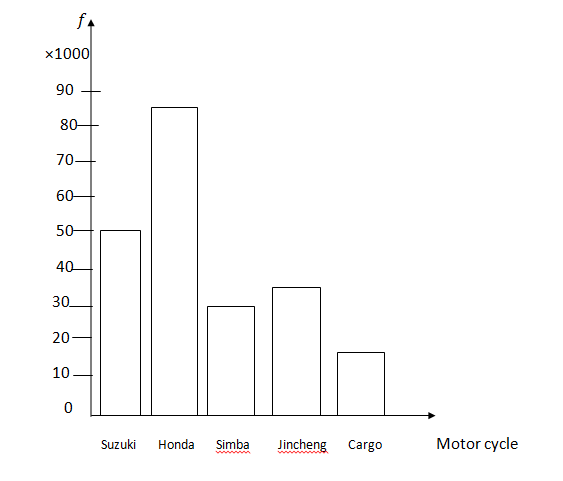
A bar chart is a tool for data representation usually made up of rectangular bars of different height conveying the proportion of the frequencies of items being represented. They are simply blocks with equal spaces in between bars used to represent data.
Example:
The following records represent the number of different motor cycles (Okada) purchased in a year from one dealer:
Motor cycle No. of Purchases
Suzuki ...50,000
Honda ...80,000
Simba ...30,000
Jincheng ...35,000
Cargo ...17,000
Prepare a bar chart to illustrate the information. How many motor cycles were purchased?
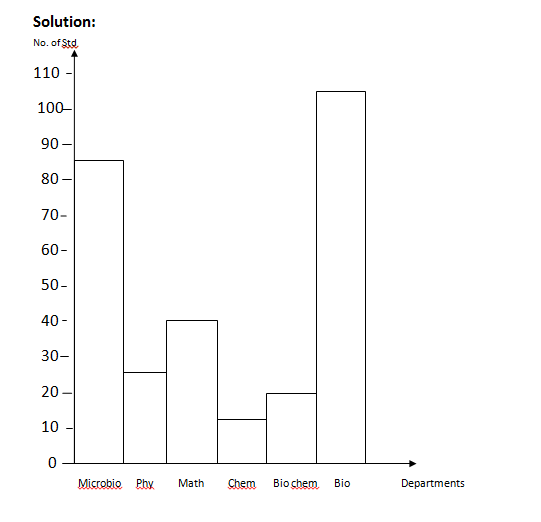
SUB TOPIC: REPRESENTATION OF INFORMATION ON HISTOGRAM.
A histogram is a tool for data representation usually made up of rectangular bars of different height conveying the proportion of the frequencies of items being represented without spaces in between bars.
Example:
The below table shows the number of students admitted in a University according to departments.
Departments ...No. of Students
Microbiology ...85
Physics ...25
Mathematics ...40
Chemistry ...15
Biochemistry ...20
Biology ...105
Illustrate the information on a histogram.
WEEKEND ASSIGNMENT:
Functional Mathematics for JSS Book3. Ex.13.2, pg 197 No. 3, 5,6,9,10
New General Mathematicss for JSS Book3 pg 153 No. 2-5
TOPIC: USE OF MEASURES OF CENTRAL TENDENCY
TO ANALYZE INFORMATION ON DRUG ABUSE.
The knowledge of measure of central tendency could help in analyzing the abuse of drugs among students as well as the youth. Specifically, it will help in:
i. finding out the most drug used;
ii. finding out the least drug used;
iii. finding out the rate of drug abuse among the youth
iv. finding out how drugs are used among the youth and in the society at large.
Examples:
1. The following data represent the frequencies at which some senior secondary students abuse drugs.
a). 33, 5, 8, 8, 10, 10, 10, 13, 15.
b). 4, 8, 9, 10, 13, 13, 15, 16, 16.
Find the mode for the drug abuse. What is its significant?
Solution:
a). The highest occurring score is 10. So, the mode for the first set of data is 10.
b). The second set of data is bimodal; i.e, it has two modes for drug abuse, 13 and 16.
The
The table below shows the rate at which some teenagers abuse drugs:
Name Ade Uche Adamu Bako Binta
Frequency 12 13 15 13 12
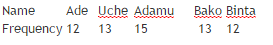
Find the mode for the drug abuse.
Solution:
Adamu consumes 15 times which is more than the rest of the people. So, Adamu is the mode for this set of data.
The following data shows the ages of some youths that take drugs:
23yrs, 19yrs, 18yrs, 30yrs
15yrs, 21yrs, 19yrs, 24yrs
25yrs, 31yrs, 17yrs, 20yrs
a). Find the median ages of the youths that take drugs.
b). Find the mean age of the youth.
Solution:
a). Rearrange in either ascending or descending order.
15yrs, 17yrs, 18yrs, 19yrs, 19yrs, 20yrs, 21yrs, 23yrs, 24yrs, 25yrs, 30yrs, 31yrs.
Counting from left or right, 20yrs and 21yrs are at the middle.
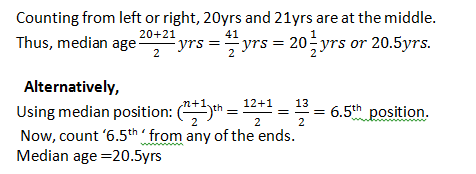
b). The mean age is the addition of all the ages divided by the number they are.
i.e, (15+17+18+19+19+20+21+23+24+25+30+31)/12 = 262/12 = 21.8yrs.
MEANING AND IMPORTANCE OF VOTING.
VOTING is a usually formal expression of opinion or will in response to a proposed decision; especially one given as an indication of approval or disapproval of a proposal, motion, or candidate for office. It is a fundamental right for every citizen of a country in a civilized and democratic nation.
THE IMPORTANCE OF VOTING AND COUNTING OF VOTES include:
i. It is a tool for selecting representatives in modern democracies.
ii. It teaches about one’s obligation as a citizen of a country to be voted for or to vote in order to elect a leader in a free and fair manner without fear or favour.
iii. It helps to detest favouritism, arrogance and tyrannism (act of using power over someone cruelly or unfairly).
iv. It helps to give room for true representation through the majority.
ANALYSIS OF VOTING USING MEASURES OF CENTRAL TENDENCY
We can analyse voting using the measures of central tendency, which are:
Mean
Median and
Mode.
Example:
The following figures represent the number of voters that voted from 2003 to 2008.
YEAR ....NO. OF VOTERS
2003 ....89,000
2004 ....101,000
2005 ....115,000
2006 ....131,000
2007 ....151,000
2008 ....96,000
a). What is the total number of voters?
b). Find the mean of the voters.
c). In what year did the people vote most?
d). In what year did the people vote least?
e). How many people voted in years 2003 and 2004?
Solution:
a). Total number of voters =(89000+101000+115000+131000+151000+96000)=683000.
b). Mean = [sup]683000[/sup]/[sub]6[/sub] = 114000 voters.
c). Year 2007
d). Year 2003.
e). Number of voters in 2003 and 2004=89000+101000=190000 voters.
EVALUTION:
The total votes cast at different centres are as follows:
5000, 7000, 9000, 10000, 12000, 17000, 18000, 15000, 9000, 18000.
Find a. the mean of the votes cast.
b. the median of the votes cast.
c. the mode of the votes cast.
ASSIGNMENT:
Functional Mathematics for JSS Book3: Ex.12.3, pg 192 No. 3-6.
Functional Mathematics for JSS Book3: pg 186 – 213.
CONTENT:
Pie chart
Bar chart
Histogram
Pictogram
Bar line, etc
SUB TOPIC: REPRESENTATION OF INFORMATION ON PIE CHARTS.
A pie chart is a tool for data representation usually in the form of a circle and divided into sectors such that the angle at the centre is proportional to the frequency representing the item.
Example:
The table below shows the number of fruits sold in a day by a fruit seller.
Types of fruits... Number
Apples ...120
Bananas ...150
Mangoes ...120
Oranges ...150
Pawpaws ...50
Pineapples ...130
Illustrate the information on a pie chart.
Solution:
SUB TOPIC: REPRESENTATION OF INFORMATION ON BAR CHARTS.
A bar chart is a tool for data representation usually made up of rectangular bars of different height conveying the proportion of the frequencies of items being represented. They are simply blocks with equal spaces in between bars used to represent data.
Example:
The following records represent the number of different motor cycles (Okada) purchased in a year from one dealer:
Motor cycle No. of Purchases
Suzuki ...50,000
Honda ...80,000
Simba ...30,000
Jincheng ...35,000
Cargo ...17,000
Prepare a bar chart to illustrate the information. How many motor cycles were purchased?
SUB TOPIC: REPRESENTATION OF INFORMATION ON HISTOGRAM.
A histogram is a tool for data representation usually made up of rectangular bars of different height conveying the proportion of the frequencies of items being represented without spaces in between bars.
Example:
The below table shows the number of students admitted in a University according to departments.
Departments ...No. of Students
Microbiology ...85
Physics ...25
Mathematics ...40
Chemistry ...15
Biochemistry ...20
Biology ...105
Illustrate the information on a histogram.
WEEKEND ASSIGNMENT:
Functional Mathematics for JSS Book3. Ex.13.2, pg 197 No. 3, 5,6,9,10
New General Mathematicss for JSS Book3 pg 153 No. 2-5
TOPIC: USE OF MEASURES OF CENTRAL TENDENCY
TO ANALYZE INFORMATION ON DRUG ABUSE.
The knowledge of measure of central tendency could help in analyzing the abuse of drugs among students as well as the youth. Specifically, it will help in:
i. finding out the most drug used;
ii. finding out the least drug used;
iii. finding out the rate of drug abuse among the youth
iv. finding out how drugs are used among the youth and in the society at large.
Examples:
1. The following data represent the frequencies at which some senior secondary students abuse drugs.
a). 33, 5, 8, 8, 10, 10, 10, 13, 15.
b). 4, 8, 9, 10, 13, 13, 15, 16, 16.
Find the mode for the drug abuse. What is its significant?
Solution:
a). The highest occurring score is 10. So, the mode for the first set of data is 10.
b). The second set of data is bimodal; i.e, it has two modes for drug abuse, 13 and 16.
The
The table below shows the rate at which some teenagers abuse drugs:
Name Ade Uche Adamu Bako Binta
Frequency 12 13 15 13 12
Find the mode for the drug abuse.
Solution:
Adamu consumes 15 times which is more than the rest of the people. So, Adamu is the mode for this set of data.
The following data shows the ages of some youths that take drugs:
23yrs, 19yrs, 18yrs, 30yrs
15yrs, 21yrs, 19yrs, 24yrs
25yrs, 31yrs, 17yrs, 20yrs
a). Find the median ages of the youths that take drugs.
b). Find the mean age of the youth.
Solution:
a). Rearrange in either ascending or descending order.
15yrs, 17yrs, 18yrs, 19yrs, 19yrs, 20yrs, 21yrs, 23yrs, 24yrs, 25yrs, 30yrs, 31yrs.
Counting from left or right, 20yrs and 21yrs are at the middle.
b). The mean age is the addition of all the ages divided by the number they are.
i.e, (15+17+18+19+19+20+21+23+24+25+30+31)/12 = 262/12 = 21.8yrs.
MEANING AND IMPORTANCE OF VOTING.
VOTING is a usually formal expression of opinion or will in response to a proposed decision; especially one given as an indication of approval or disapproval of a proposal, motion, or candidate for office. It is a fundamental right for every citizen of a country in a civilized and democratic nation.
THE IMPORTANCE OF VOTING AND COUNTING OF VOTES include:
i. It is a tool for selecting representatives in modern democracies.
ii. It teaches about one’s obligation as a citizen of a country to be voted for or to vote in order to elect a leader in a free and fair manner without fear or favour.
iii. It helps to detest favouritism, arrogance and tyrannism (act of using power over someone cruelly or unfairly).
iv. It helps to give room for true representation through the majority.
ANALYSIS OF VOTING USING MEASURES OF CENTRAL TENDENCY
We can analyse voting using the measures of central tendency, which are:
Mean
Median and
Mode.
Example:
The following figures represent the number of voters that voted from 2003 to 2008.
YEAR ....NO. OF VOTERS
2003 ....89,000
2004 ....101,000
2005 ....115,000
2006 ....131,000
2007 ....151,000
2008 ....96,000
a). What is the total number of voters?
b). Find the mean of the voters.
c). In what year did the people vote most?
d). In what year did the people vote least?
e). How many people voted in years 2003 and 2004?
Solution:
a). Total number of voters =(89000+101000+115000+131000+151000+96000)=683000.
b). Mean = [sup]683000[/sup]/[sub]6[/sub] = 114000 voters.
c). Year 2007
d). Year 2003.
e). Number of voters in 2003 and 2004=89000+101000=190000 voters.
EVALUTION:
The total votes cast at different centres are as follows:
5000, 7000, 9000, 10000, 12000, 17000, 18000, 15000, 9000, 18000.
Find a. the mean of the votes cast.
b. the median of the votes cast.
c. the mode of the votes cast.
ASSIGNMENT:
Functional Mathematics for JSS Book3: Ex.12.3, pg 192 No. 3-6.
Functional Mathematics for JSS Book3: pg 186 – 213.
WEEK 4
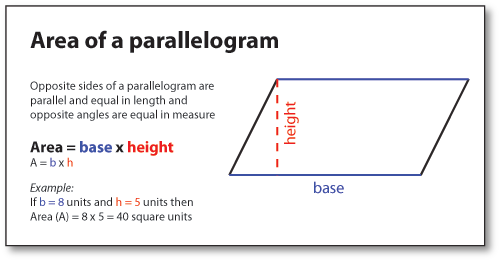
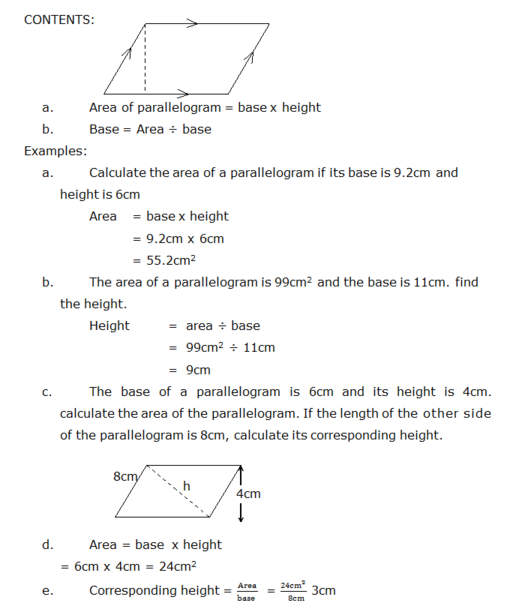
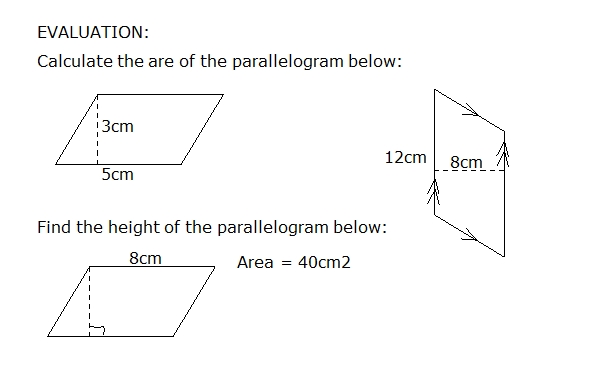
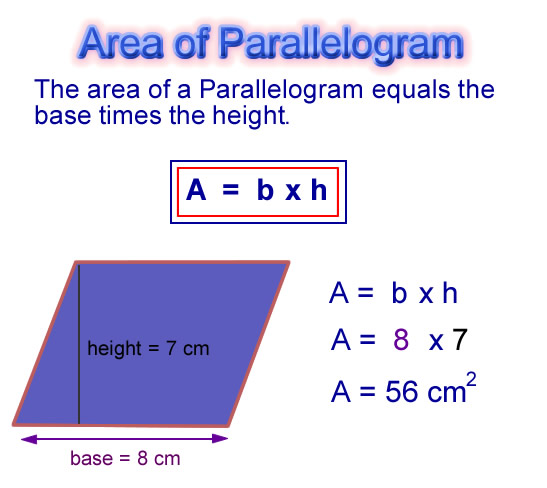
SPECIFIC TOPIC: Area of parallelogram
PERFORMANCE OBJECTIVE: At the end of this lesson, students should be able to calculate the area of given parallelogram
REFERENCE BOOK: New General Maths for JSS1, page 116
CONTENT (View Below)
https://skydrive.live.com/P.mvc#!/view. ... 2A33%21177
ASSIGNMENT: New General Maths for JSS1, page 118, Q 14 & 17
further studies
http://www.mathsisfun.com/area.html
http://www.mathopenref.com/parallelogramarea.html
http://www.mathexpression.com/area-of-a ... ogram.html
practice test
http://www.mathgoodies.com/lessons/vol1 ... ogram.html
http://www.proprofs.com/quiz-school/qui ... &quesnum=1
http://www.glencoe.com/sec/math/studyto ... 0&lesson=1
LESSON 78
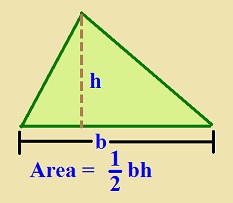
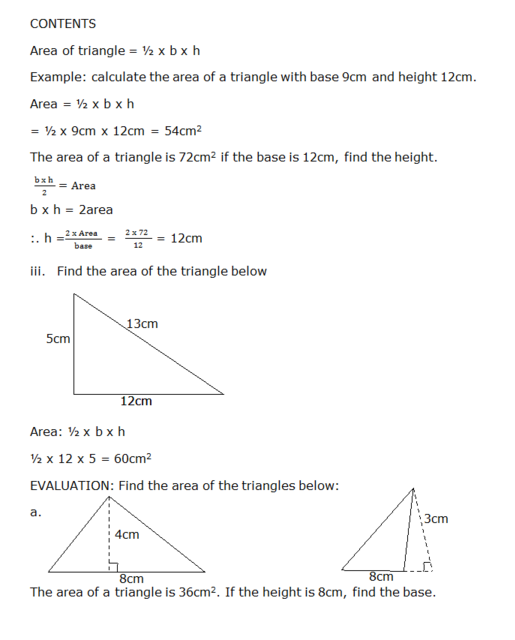
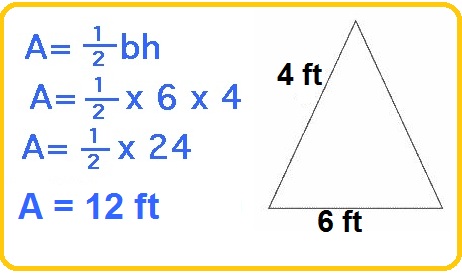
TOPIC: Area of triangles
PERFORMANCE OBJECTIVES: At the end of this lesson, students should be able to calculate area of given triangles
REFERENCES BOOK: New General Maths for JSS 1 page 118
CONTENT (View below)
https://skydrive.live.com/P.mvc#!/view. ... 2A33%21180
ASSIGNMENT: New Genera; Maths for JSS2 page 120. Ex 14d, Nos 1 e,f,g.
further studies
http://www.mathgoodies.com/lessons/vol1 ... angle.html
http://www.mathopenref.com/trianglearea.html
http://www.mathgoodies.com/lessons/vol1 ... angle.html
practice test
http://algebra4children.com/area_of_triangle.html
http://www.mathopenref.com/quiztriangle1.html
http://www.aaamath.com/geo78_x6.htm#section2
http://www.transum.org/software/SW/Star ... e/Quiz.asp
http://www.softschools.com/quiz_time/ma ... heme1.html
LESSON 79
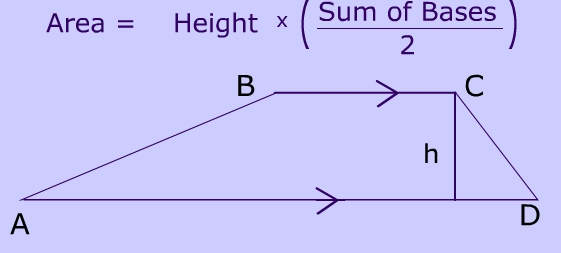
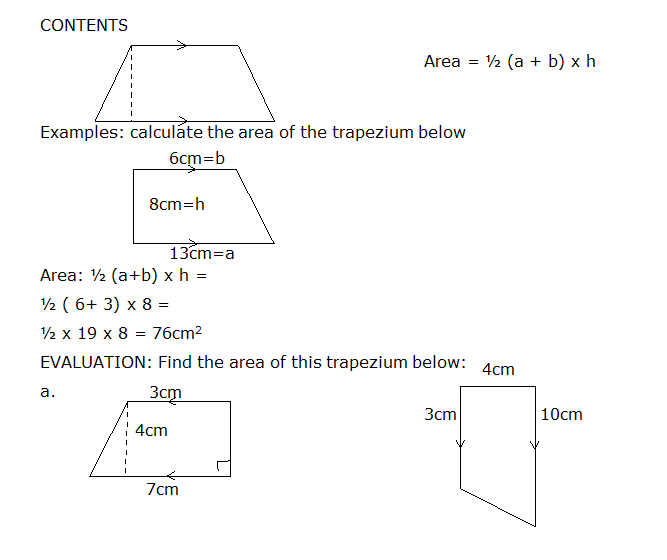
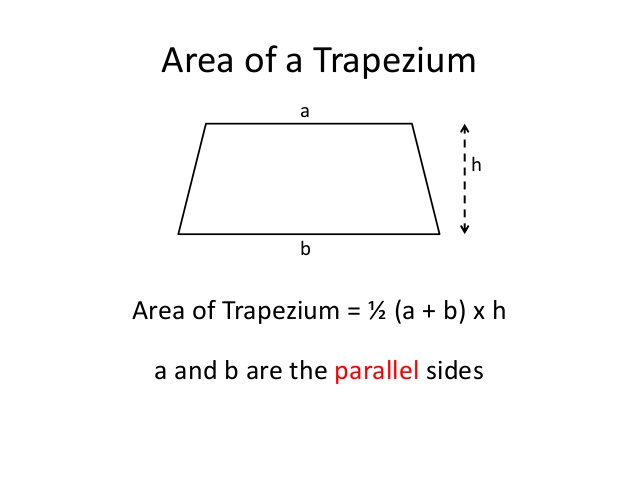
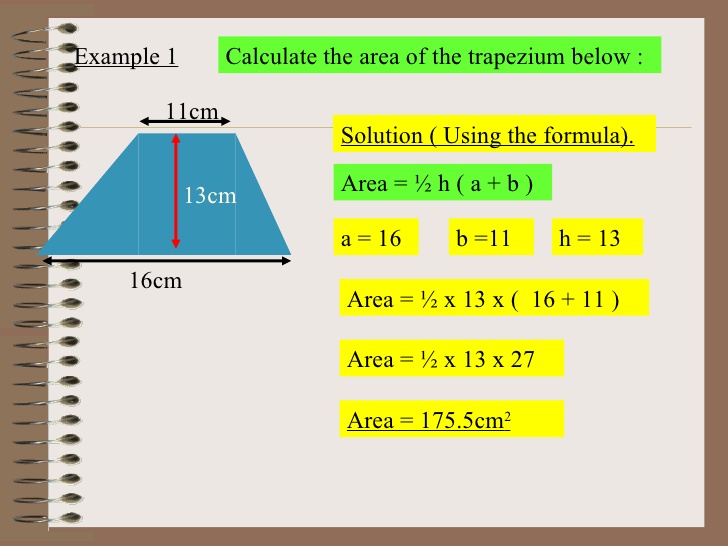
TOPIC: Area of trapezium
PERFORMANCE OBJECTIVE: At the end of the lesson students should be able to calculate the area of trapezium
CONTENT (View below)
https://skydrive.live.com/P.mvc#!/view. ... 2A33%21179
ASSIGNMENT: New General Maths for JSS 1, page 121, numbers 2 g and h
further studies
http://www.mathsteacher.com.au/year10/c ... 19trap.htm
http://www.mathsteacher.com.au/year8/ch ... p/trap.htm
practice test
http://www.mathgoodies.com/lessons/vol1 ... ezoid.html
http://www.glencoe.com/sec/math/studyto ... 2&lesson=1
http://www.mrperezonlinemathtutor.com/Q ... s_quiz.htm
[youtube]http://www.youtube.com/watch?v=qlxawNewXiY[/youtube]
LESSON 80
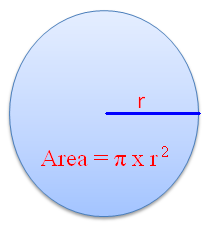
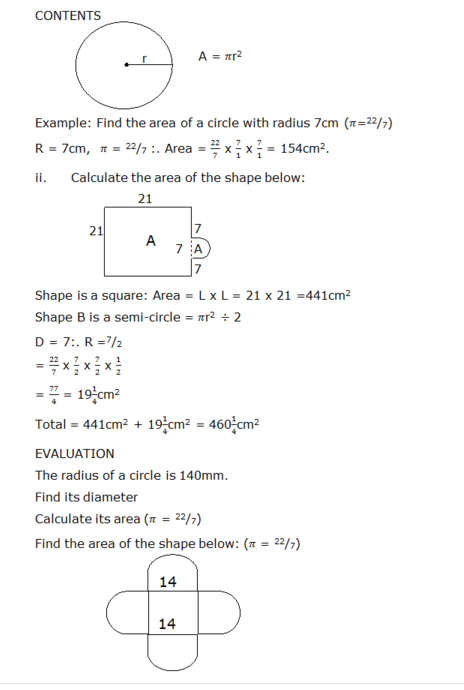
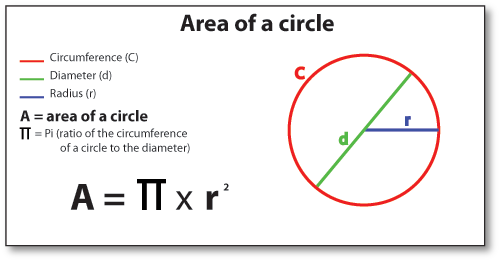
TOPIC: Area of Circles
PERFORMANCE OBJECTIVE: At the end of this lesson, students should be able to calculate the area of circles
CONTENT (View below)
https://skydrive.live.com/P.mvc#!/view. ... 2A33%21193
ASSIGNMENT: New General Maths for JSS bk 3, page 122, Numbers 2a, b, & f
further studies
http://www.mathsteacher.com.au/year8/ch ... circle.htm
http://areacircle.com/
practice test
http://www.aaamath.com/exp612x2.htm
http://www.kidsnewsroom.org/elmer/infoc ... aQuiz.html
http://www.glencoe.com/sec/math/studyto ... e=4&state=
http://www.mathsquad.com/cgi-bin/quizte ... circlequiz
PERFORMANCE OBJECTIVE: At the end of this lesson, students should be able to calculate the area of given parallelogram
REFERENCE BOOK: New General Maths for JSS1, page 116
CONTENT (View Below)
https://skydrive.live.com/P.mvc#!/view. ... 2A33%21177
ASSIGNMENT: New General Maths for JSS1, page 118, Q 14 & 17
further studies
http://www.mathsisfun.com/area.html
http://www.mathopenref.com/parallelogramarea.html
http://www.mathexpression.com/area-of-a ... ogram.html
practice test
http://www.mathgoodies.com/lessons/vol1 ... ogram.html
http://www.proprofs.com/quiz-school/qui ... &quesnum=1
http://www.glencoe.com/sec/math/studyto ... 0&lesson=1
LESSON 78
TOPIC: Area of triangles
PERFORMANCE OBJECTIVES: At the end of this lesson, students should be able to calculate area of given triangles
REFERENCES BOOK: New General Maths for JSS 1 page 118
CONTENT (View below)
https://skydrive.live.com/P.mvc#!/view. ... 2A33%21180
ASSIGNMENT: New Genera; Maths for JSS2 page 120. Ex 14d, Nos 1 e,f,g.
further studies
http://www.mathgoodies.com/lessons/vol1 ... angle.html
http://www.mathopenref.com/trianglearea.html
http://www.mathgoodies.com/lessons/vol1 ... angle.html
practice test
http://algebra4children.com/area_of_triangle.html
http://www.mathopenref.com/quiztriangle1.html
http://www.aaamath.com/geo78_x6.htm#section2
http://www.transum.org/software/SW/Star ... e/Quiz.asp
http://www.softschools.com/quiz_time/ma ... heme1.html
LESSON 79
TOPIC: Area of trapezium
PERFORMANCE OBJECTIVE: At the end of the lesson students should be able to calculate the area of trapezium
CONTENT (View below)
https://skydrive.live.com/P.mvc#!/view. ... 2A33%21179
ASSIGNMENT: New General Maths for JSS 1, page 121, numbers 2 g and h
further studies
http://www.mathsteacher.com.au/year10/c ... 19trap.htm
http://www.mathsteacher.com.au/year8/ch ... p/trap.htm
practice test
http://www.mathgoodies.com/lessons/vol1 ... ezoid.html
http://www.glencoe.com/sec/math/studyto ... 2&lesson=1
http://www.mrperezonlinemathtutor.com/Q ... s_quiz.htm
[youtube]http://www.youtube.com/watch?v=qlxawNewXiY[/youtube]
LESSON 80
TOPIC: Area of Circles
PERFORMANCE OBJECTIVE: At the end of this lesson, students should be able to calculate the area of circles
CONTENT (View below)
https://skydrive.live.com/P.mvc#!/view. ... 2A33%21193
ASSIGNMENT: New General Maths for JSS bk 3, page 122, Numbers 2a, b, & f
further studies
http://www.mathsteacher.com.au/year8/ch ... circle.htm
http://areacircle.com/
practice test
http://www.aaamath.com/exp612x2.htm
http://www.kidsnewsroom.org/elmer/infoc ... aQuiz.html
http://www.glencoe.com/sec/math/studyto ... e=4&state=
http://www.mathsquad.com/cgi-bin/quizte ... circlequiz
WEEK 5
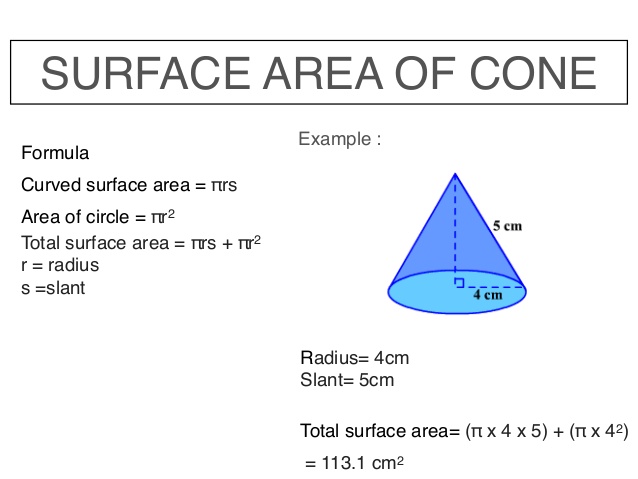
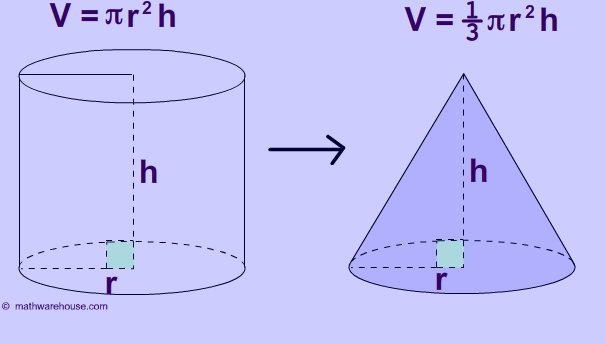
MAIN TOPIC: Cones
SPECIFIC TOPIC: Curved surface area of a cone
PERFORMANCE OBJECTIVE: At the end of this lesson, students should be able to calculate the curved surface area of a cone.
CONTENTS
Examples: A cone has a base radius of 5cm and a height of 12cm. calculate its start height. (ii) its curved surface area.
(i) By Pythagoras : L2 = 122 + 52
144 + 25
= 169
:. L = = 13cm
ii. Curved surface area = rl
= x x 13 or 3.14 x 5 x 13 3.14 x 65 = 204.1cm2
Reference book: New general maths books page 188
EVALUATION
a. A cone has a base radius of 3cm and a height of 4cm
i. Calculate its slant height
ii. Find its curved surface area
b. Use Pythagoras rule to find the slant height of a cone which has a height of 8cm and a base radius of 6cm.
ASSIGNMENT: New general maths for JSS2 page 189. Ex 19e Nos 1c & d.
further studies
http://www.mathsteacher.com.au/year10/c ... 20cone.htm
http://hotmath.com/hotmath_help/topics/ ... -cone.html
http://www.web-formulas.com/Math_Formul ... _Cone.aspx
practice test
http://quizlet.com/299786/areavolume-fo ... ash-cards/
http://www.kwiznet.com/p/takeQuiz.php?C ... 8&Num=4.34
REVISION
Revision Exercise 1
http://quiz.econ.usyd.edu.au/mathquiz/s ... /index.php
http://www.suffolkmaths.co.uk/pages/1Al ... ources.htm
http://www.onlinemathlearning.com/algebra-help.html
http://www.softschools.com/quizzes/math/
http://www.glencoe.com/sec/math/algebra ... ex.php4/na
http://mymcas.com/html_pages/quizzes.htm
http://www.ischool.zm/1417/grade_11/p29 ... &subhide=1
http://www.classzone.com/books/geometry ... tional.cfm
Comprehensive revision exercise on Basic 9 (JSS3) Mathematics
Comprehensive revision exercise on Geometry